Machine learning-assisted fracture prediction: integrating synthetic and experimental data for quasi-static notch failure analysis
Introduction
Polycarbonate (PC) is a high performance thermoplastic that possesses high impact resistance, excellent mechanical strength, making it suitable for high impact applications
Notches and other defects are often inherent due to design limitations, manufacturing processes or in-service damage. Geometrical discontinuities act as stress concentrators and potential crack initiation sites, which create complex stress and strain distributions near the notch tip, thereby complicating the fracture prediction. Consequently, it is essential to have a reliable design methodology for predicting the fracture load on notched members [9]. Traditional fracture mechanics methods often fall short in capturing the fracture behavior of notched ductile polymers such as polycarbonate under quasistatic loading [10]. Numerous continuum-mechanics based constitutive models have been developed over recent decades to describe the complex mechanical behavior of polycarbonate, accounting for viscoplastic behavior and notch sensitivity [1113]. While these models significantly enhance predictive accuracy, they require extensive experimental calibration and computational effort. Therefore, alternative methods such as Theory of Critical Distances (TCD) [14] and Strain Energy Density (SED) [15] have gained significant attention to estimate the fracture of different notch geometries and materials, without the need for extensive crack growth modeling.
Among these methods, TCD is most widely used due to its simplicity for accurate fracture prediction in notched members. Among its various formulations, the point method of TCD (TCD-PM) has been particularly favored due to its ease of implementation and low computational cost. TCD has been successfully applied to a wide range of materials and notch geometries, estimating fracture under quasi-static and dynamic loading conditions [16-18]. Another important aspect of TCD is its ability to predict fracture accurately without requiring non-linear material modelling or complex computational analyses. Nonetheless, TCD still depends on accurate stress fields obtained from finite element analysis and requires experimental data to calibrate its parameters. Conducting fracture experiments across a wide range of geometrical configurations can be costly and time-consuming, particularly for ductile materials like polycarbonate. Additionally, experimental techniques such as Digital Image Correlation (DIC), also add to complexity and cost of the experimental testing [19].
In recent years, data driven approaches based on Artificial Intelligence (AI) and Machine Learning (ML) have emerged as powerful techniques for predictive modeling in fracture mechanics. ML algorithms have shown exceptional capabilities in
capturing complex non-linear relationships and making accurate predictions even with limited input data. Recently, many ML models, such as decision trees, random forests, support vector machines (SVM), and gradient boosting frameworks like XGBoost have shown great promise in predicting fracture and fatigue in various engineering materials [20,21]. Moreover, the use of synthetic datasets generated from finite element simulations have been used for the training of different ML models, reducing the need for extensive experimental data and testing. Aldakheel et al. [22] developed a physics-based ML framework trained on synthetic dataset generated from finite element-based phase-field fracture simulations to predict both brittle and ductile fracture. Similarly, Xu. et al., proposed Crack-Net, which uses phase-field simulation data to train a deep learning model that predicts crack propagation in composite materials [23]. Further, Mocerino et al., [24] trained a surrogate ANN model using synthetic data generated with the cohesive crack-finite element model, to estimate fracture parameters in translaminar fracture of structural composites. These studies demonstrate that use of synthetic datasets in ML training is becoming a practical route to reduce dependency on expensive experimental testing.
This study aims to combine the synthetic datasets generated using TCD-PM with experimental data to train an XGBoost machine learning model for predicting the quasi-static fracture behavior of notched polycarbonate specimens. Experimental data is reduced systematically and replaced with synthetic data to analyze the predictability of the model minimizing experimental testing.
Notches and other defects are often inherent due to design limitations, manufacturing processes or in-service damage. Geometrical discontinuities act as stress concentrators and potential crack initiation sites, which create complex stress and strain distributions near the notch tip, thereby complicating the fracture prediction. Consequently, it is essential to have a reliable design methodology for predicting the fracture load on notched members [9]. Traditional fracture mechanics methods often fall short in capturing the fracture behavior of notched ductile polymers such as polycarbonate under quasistatic loading [10]. Numerous continuum-mechanics based constitutive models have been developed over recent decades to describe the complex mechanical behavior of polycarbonate, accounting for viscoplastic behavior and notch sensitivity [1113]. While these models significantly enhance predictive accuracy, they require extensive experimental calibration and computational effort. Therefore, alternative methods such as Theory of Critical Distances (TCD) [14] and Strain Energy Density (SED) [15] have gained significant attention to estimate the fracture of different notch geometries and materials, without the need for extensive crack growth modeling.
Among these methods, TCD is most widely used due to its simplicity for accurate fracture prediction in notched members. Among its various formulations, the point method of TCD (TCD-PM) has been particularly favored due to its ease of implementation and low computational cost. TCD has been successfully applied to a wide range of materials and notch geometries, estimating fracture under quasi-static and dynamic loading conditions [16-18]. Another important aspect of TCD is its ability to predict fracture accurately without requiring non-linear material modelling or complex computational analyses. Nonetheless, TCD still depends on accurate stress fields obtained from finite element analysis and requires experimental data to calibrate its parameters. Conducting fracture experiments across a wide range of geometrical configurations can be costly and time-consuming, particularly for ductile materials like polycarbonate. Additionally, experimental techniques such as Digital Image Correlation (DIC), also add to complexity and cost of the experimental testing [19].
In recent years, data driven approaches based on Artificial Intelligence (AI) and Machine Learning (ML) have emerged as powerful techniques for predictive modeling in fracture mechanics. ML algorithms have shown exceptional capabilities in
capturing complex non-linear relationships and making accurate predictions even with limited input data. Recently, many ML models, such as decision trees, random forests, support vector machines (SVM), and gradient boosting frameworks like XGBoost have shown great promise in predicting fracture and fatigue in various engineering materials [20,21]. Moreover, the use of synthetic datasets generated from finite element simulations have been used for the training of different ML models, reducing the need for extensive experimental data and testing. Aldakheel et al. [22] developed a physics-based ML framework trained on synthetic dataset generated from finite element-based phase-field fracture simulations to predict both brittle and ductile fracture. Similarly, Xu. et al., proposed Crack-Net, which uses phase-field simulation data to train a deep learning model that predicts crack propagation in composite materials [23]. Further, Mocerino et al., [24] trained a surrogate ANN model using synthetic data generated with the cohesive crack-finite element model, to estimate fracture parameters in translaminar fracture of structural composites. These studies demonstrate that use of synthetic datasets in ML training is becoming a practical route to reduce dependency on expensive experimental testing.
This study aims to combine the synthetic datasets generated using TCD-PM with experimental data to train an XGBoost machine learning model for predicting the quasi-static fracture behavior of notched polycarbonate specimens. Experimental data is reduced systematically and replaced with synthetic data to analyze the predictability of the model minimizing experimental testing.
Materials and methods
Materials and specimen preparation
The material used in this study is Polycarbonate (PC). A PC sheet with dimensions of 3000 mm in length and 2050 mm in width and thickness 6 mm was sourced from Rowad National Plastic company, Saudi Arabia. The properties of the PC sheet provided by the company are summarized in Tab. 1.
| Modulus of Elasticity | Tensile Strength | Elongation at Yield | Elongation at Fracture |
| 2400 MPa |
Table 1: Properties of PC sheet (as provided by the manufacturer).
Standard tensile and U-notched rectangular specimens were cut from this PC sheet. The tensile specimens were machined as per ASTM D638-22 standard [25], with dimensions as shown in Fig. 1. A total of eleven U-notched samples with varying notch depths

Figure 1: Tensile Specimen. All dimensions are in mm .

Figure 2: U-notched specimens. All dimensions are in mm .
Experimental testing procedure
The mechanical tests were conducted under quasi-static loading conditions on Instron 5569 universal testing machine equipped with a 50 kN load cell. All tests were performed at a constant displacement rate of
were performed on five specimens and strain was measured using two independent systems: a clip-on extensometer and a Digital Image Correlation system. The fracture experiments on U-notched specimens were conducted to determine the fracture load for eleven different configurations with notch depths ranging from 4 mm and 7 mm and notch radii between 1.5 mm and 5 mm . Three duplicates were tested for each configuration to ensure reproducibility. DIC was used for selected samples to visualize and quantify the strain field near the notch tip.
were performed on five specimens and strain was measured using two independent systems: a clip-on extensometer and a Digital Image Correlation system. The fracture experiments on U-notched specimens were conducted to determine the fracture load for eleven different configurations with notch depths ranging from 4 mm and 7 mm and notch radii between 1.5 mm and 5 mm . Three duplicates were tested for each configuration to ensure reproducibility. DIC was used for selected samples to visualize and quantify the strain field near the notch tip.
Determination of TCD parameters
The Theory of Critical Distances-Point Method (TCD-PM) was used in this study to estimate the fracture in the U-notched specimens. TCD-PM assumes that fracture occurs when the stress at a certain distance from the notch tip, known as critical distance, reaches a material-dependent critical value [14]. The critical distance (
The critical distance and the inherent strength can also be calculated experimentally for materials exhibiting plastic behavior. The inherent strength and critical distance have been determined in our previous works
Finite element modeling and fracture load predictions
A linear elastic element model was developed in ANSYS Mechanical via PyMAPDL to simulate the U-notched specimens and extract stress values for TCD-PM calculations. As already mentioned, TCD-PM is based on linear elastic analysis, so the material behavior of polycarbonate was assumed to be linear elastic with Young's modulus and Poisson's ratio equal to 2267.6 MPa and 0.38 , respectively [26]. Although polycarbonate exhibits elastic-plastic behavior under large deformation, the use of a linear-elastic material model was adopted to maintain consistency with the theoretical basis of TCD-PM approach, which evaluates fracture initiation from elastic stress distribution at a defined critical distance from the notch-tip. Experimental results discussed in result section showed that fracture initiation coincides with the onset of necking, where the local stress field can still be approximated as linear elastic. Therefore, adapting a linear-elastic material model ensures consistency between the experimental fracture load and TCD-PM predictions, as also reported in previous studies [9,26]. The geometry was modeled as a 2D plane stress with thickness with actual specimen dimensions, however only half the specimen was modeled due to symmetry of the specimen. The geometry was meshed using Plane 183 elements with refined meshing near the notch tip as shown in Fig. 3. For the boundary conditions, the displacement was restricted in the vertical direction at the lower edge of sample and in the horizontal direction at the edge of the geometry. The load was applied as a negative pressure at the top edge to simulate quasi-static loading [26]. Fracture loads were calculated for the eleven specimens by incrementally applying the load and calculating the stress at the critical distance ( 6.95 mm ) with the inherent strength of the material ( 54.5 MPa ). The load at which the stress is equal to inherent strength was taken as fracture load for that geometry.
Synthetic dataset generation using PYMAPDL
The synthetic dataset used in the machine learning model was generated using PYMAPDL by varying the notch depth and notch radius. A total of 32 synthetic data points were produced with notch radii ranging from 1.5 mm to 4.5 mm , and depths from 4.5 mm to 10 mm , without overlapping the experimental specimen geometries. The same finite element analysis setup and material model were employed. A looped simulation was implemented where the load gradually increased in steps of 50 N , and the maximum principal stress at critical distance was extracted at each step, until it reaches or exceeds the inherent strength value of 54.5 MPa . If the stress exceeds this value, the routine fine- tunes the load steps to 5 N and then to 1 N , running the simulation from the last load which corresponds to stress below inherent strength, until it reaches the value of 54.5 MPa to accurately determine the fracture load. The final load where the maximum principal stress at the critical distance
to mention that the synthetic dataset generated is valid within the geometric and material assumptions inherent to finite element model. The notch radius
to mention that the synthetic dataset generated is valid within the geometric and material assumptions inherent to finite element model. The notch radius
Machine Learning framework
In this study, XGBoost (Extreme Gradient Boosting), a ML boosting algorithm for regression by Chen and Guertin [27] was used for its robust performance in regression problems, particularly in handling small and medium datasets with nonlinear dependencies. XGBoost combines the predictions to arrive at a final prediction which is the sum of the predictions of all weak learners. XGBoost has an inbuilt capacity for regularization and avoids overfitting [28].
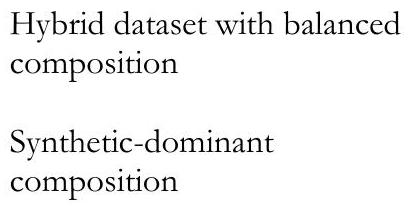
The model was trained using combinations from the 33 experimental points (three duplicates for each of the 11 geometries) and 32 synthetic data points. The input features were the notch radius and notch depth, while the target variable was fracture load. A total of six combinations were tested including experimental-only data (22), hybrid combinations (e.g.,
The model was trained using combinations from the 33 experimental points (three duplicates for each of the 11 geometries) and 32 synthetic data points. The input features were the notch radius and notch depth, while the target variable was fracture load. A total of six combinations were tested including experimental-only data (22), hybrid combinations (e.g.,

Figure 3: (a) View of the general mesh and (b) Refined mesh around notch area.
 |
|
||||||||||||
| Exp-only | 22 Experimental | Baseline reference model | |||||||||||
|
|
|
Evaluate effect of limited synthetic data | ||||||||||
| 11 Experimental + 11 Synthetic |
|
 |
|||||||||||
| Synthetic only | 22 Synthetic | Evaluate synthetic-only generalization | |||||||||||
| Full Dataset (Exp + Synthetic) |
|
Combined model for maximum robustness | |||||||||||
Table 2: Summary of XGBoost model training and validation setup
The XGBoost regressor was configured with 500 n_estimators, a learning rate of 0.01 and maximum tree depth of 5 . These parameters were selected to ensure stable convergence and avoid overfitting, especially given the relatively small dataset size. In addition, to ensure consistency in results, each model was trained using the same random state (39) and number of data points ( 22 for training) with only the composition of experimental and synthetic data varying between them. The only exception being the full dataset model which used all 54 data points for training. The model performance was evaluated using standard regression metrics including Mean Absolute Percentage Error (MAPE), Root Mean Square Error (RMSE), Mean Absolute Error (MAE) and Coefficient of Determination (
Results and discussion
Tensile specimen test results
The stress-strain curve from the tensile testing of polycarbonate specimens using both an extensometer and Digital Image Correlation (DIC) is presented in Fig. 4(a). The stress-strain curves obtained from the extensometer and DIC system show good agreement up to the necking point. The tensile behavior of the specimen is comprehensively discussed in our previous works [9,26]. The typical tensile behavior for polycarbonate can be seen in the load-displacement curve for one of the specimens, illustrated in Fig. 4(b).
From the figure, a sudden drop in the load can be seen at Point A, which corresponds to the necking of the material. After the drop, the material continues to deform with growth of a plastic band until complete failure. However, necking point itself is considered as the failure point, which provides a consistent point of comparison for experimental results with TCDPM which is based on a linear-elastic assumption. The average mechanical properties obtained from tensile tests are summarized in Tab. 3.
From the figure, a sudden drop in the load can be seen at Point A, which corresponds to the necking of the material. After the drop, the material continues to deform with growth of a plastic band until complete failure. However, necking point itself is considered as the failure point, which provides a consistent point of comparison for experimental results with TCDPM which is based on a linear-elastic assumption. The average mechanical properties obtained from tensile tests are summarized in Tab. 3.

Figure 4: (a) True stress-strain curve obtained with DIC and extensometer, and (b) Load Displacement curve. Point A corresponds to beginning of necking.
| Property | Average Value | Standard Deviation |
| Young's Modulus |
2267.60 MPa | 47.01 |
| Yield Stress |
36.1 MPa | 1.96 |
| Yield Strain |
0.0177 | 0.0013 |
| Necking Stress |
66 MPa | 0.59 |
Table 3: Average mechanical properties of polycarbonate specimens from tensile test.
Fracture Behavior of U-notched Specimens
The fracture behavior of polycarbonate U-notched specimens was investigated under quasi-static tensile loading with specimens being loaded until complete failure. A detailed discussion of the failure mechanisms has been presented in our previous work [9]. In this section, we briefly summarize the key findings in the fracture of U-notched specimens.
Based on the nominal stress versus extension curves presented in Fig. (a) and 5(b) respectively, two distinct fracture modes can be observed, which are thoroughly discussed in [9]. In sharper notches such as those with
such as
Based on the nominal stress versus extension curves presented in Fig. (a) and 5(b) respectively, two distinct fracture modes can be observed, which are thoroughly discussed in [9]. In sharper notches such as those with
such as
Fracture load prediction using the Theory of Critical Distances (TCD-PM)
The fracture loads of notched polycarbonate specimens were estimated based on TCD-PM formulation. As mentioned previously, the fracture load is predicted by the finite element simulation using PYMAPDL by comparing the maximum principal stress at critical distance of 6.95 mm from notch tip with the inherent strength ( 54.5 MPa ) of the polycarbonate. The predicted loads for all eleven experimental notch geometries were compared with the experimentally determined average fracture load, are summarized in Tab. 4 along with the percentage deviation.
The results show that the TCD-PM-based fracture load predictions show close agreement with the experimental data with discrepancies within
The results show that the TCD-PM-based fracture load predictions show close agreement with the experimental data with discrepancies within

Figure 5: (a) Stress-Elongation curves for specimens with
| Average Experimental Fracture Load, N | TCD-Predicted Fracture Load, N | Percentage Error | ||
| 1.5 | 6 | 6885.8 | 6893.2 | 0.11 |
| 2 | 6 | 6703.8 | 6832.6 | 1.92 |
| 2.5 | 6 | 7018.3 | 6774.4 | -3.48 |
| 3 | 6 | 6798.4 | 6718.7 | -1.17 |
| 3.5 | 6 | 6637.3 | 6665.5 | 0.42 |
| 4 | 6 | 6448.8 | 6614.8 | 2.57 |
| 4.5 | 6 | 6499.7 | 6566.6 | 1.03 |
| 5 | 6 | 6427 | 6520.8 | 1.46 |
| 3.5 | 4 | 7054.3 | 7364.3 | 4.39 |
| 3.5 | 5.5 | 6582.3 | 6827.6 | 3.73 |
| 3.5 | 7 | 6591 | 6377.3 | -3.24 |
Table 4: Estimated fracture load using TCD-PM Method, with percentage deviation from actual average experimental fracture load.

Figure 6: Predicted vs. actual fracture load plots for training and test data across six machine learning models trained on different combinations of experimental and synthetic data. The shaded region indicates a
Performance of ML models for fracture load prediction
The XGBoost models were trained to evaluate the effect of the synthetic data on the model accuracy and robustness in predicting the fracture loads of U-notched polycarbonate specimens. Fig. 6 presents the actual vs. predicted for all six different models with
data points demonstrated the most consistent alignment with the ideal fit line, achieving the lowest prediction error (MAPE
The standard regression metrics for all six training compositions are presented in Fig. 7, which highlights that the full dataset training composition achieved the lowest MAPE (
data points demonstrated the most consistent alignment with the ideal fit line, achieving the lowest prediction error (MAPE
The standard regression metrics for all six training compositions are presented in Fig. 7, which highlights that the full dataset training composition achieved the lowest MAPE (

Figure 7: Performance comparison of six machine learning models trained on varying combinations of experimental and synthetic data.
| Experimental Fracture Load, N | ML-Predicted Fracture Load, N | Percentage Error | ||
| 1.5 | 6 | 6870.6 | 6865.826 | -0.07 |
| 2 | 6 | 6741 | 6725.73 | -0.23 |
| 2.5 | 6 | 7026 | 6984.101 | -0.60 |
| 3 | 6 | 6988.1 | 6698.816 | -4.14 |
| 3.5 | 6 | 6614.9 | 6646.832 | 0.48 |
| 4 | 6 | 6341.5 | 6505.538 | 2.59 |
| 4.5 | 6 | 6600 | 6449.638 | -2.28 |
| 5 | 6 | 6444 | 6427.098 | -0.26 |
| 3.5 | 4 | 7045 | 7062.107 | 0.24 |
| 3.5 | 5.5 | 6554 | 6599.902 | 0.70 |
| 3.5 | 7 | 6522 | 6610.532 | 1.36 |
Table 5: Estimated fracture load using XGBoost for full dataset compared with experimental test data.
Conclusion
In this study, a fracture mechanics and machine learning approaches were used to predict the quasi-static fracture load of U-notched polycarbonate specimens based on geometric features. Predictions from TCD-PM method showed close agreement with the experimental results. Further, a novel machine learning framework was developed using XGBoost regression model to predict the fracture loads based on notch geometry. The XGBoost regression models were trained with varying combinations of experimental and synthetic data generated using TCD-based PyMAPDL simulations. The results showed that among all combinations, the model trained with full dataset of experimental and synthetic data points achieved the best performance with a MAPE of
References
[1] Faye, A., Parmeswaran, V., Basu, S. (2015). Mechanics of dynamic fracture in notched polycarbonate, Journal of the Mechanics and Physics of Solids, 77, pp. 43-60. DOI: https://doi.org/10.1016/j.jmps.2015.01.003.
[2] Jadhav, V.D., Patil, A.J., Kandasubramanian, B. (2022). Polycarbonate Nanocomposites for High Impact Applications., In: Mallakpour, S., Hussain, C.M. eds., Handbook of Consumer Nanoproducts, Singapore, Springer Nature Singapore, pp. 257-281.
[3] Strong, A.B. (2006). Plastics: materials and processing, USA, Pearson Prentice Hall.
[4] Hotaka, T., Kondo, F., Niimi, R., Togashi, F., Morita, Y. (2019). Industrialization of automotive glazing by polycarbonate and hard-coating, Polymer Journal, 51(12), pp. 1249-1263.
DOI: https://doi.org/10.1038/s41428-019-0240-1.
[5] Alaboodi, A.S., Sivasankaran, S. (2018). Experimental design and investigation on the mechanical behavior of novel 3D printed biocompatibility polycarbonate scaffolds for medical applications, Journal of Manufacturing Processes, 35, pp. 479-491. DOI: https://doi.org/10.1016/j.jmapro.2018.08.035.
[6] Zhang, W., Xu, Y. (2019). Mechanical properties of polycarbonate: experiment and modeling for aeronautical and aerospace applications, Elsevier.
[7] Ab Rahim, N.R., Dr Seyed Jamalaldin Seyed Hakim. (2022). Performance of Polycarbonate Concrete Panels in Construction: A Critical Research Review, Rtcebe, 3(1), pp. 320-331.
[8] Gupta, A., Goyal, R. (2019). Electrical properties of polycarbonate/expanded graphite nanocomposites, Journal of Applied Polymer Science, 136(13), p. 47274.
[9] Albinmousa, J., AlSadah, J., Hawwa, M.A., Al-Qahtani, H.M. (2021). Estimation of mode I fracture of u-notched polycarbonate specimens using the equivalent material concept and strain energy density, Applied Sciences, 11(8), p. 3370.
[10] Grellmann, W., Langer, B. (2017). Deformation and fracture behaviour of polymer materials, vol. 247, Springer.
[11] Gearing, B., Anand, L. (2004). Notch-sensitive fracture of polycarbonate, International Journal of Solids and Structures, 41(3-4), pp. 827-845.
[12] Faye, A., Parameswaran, V., Basu, S. (2016). Effect of notch-tip radius on dynamic brittle fracture of polycarbonate, Experimental Mechanics, 56, pp. 1051-1061.
[13] Wang, H., Zhou, H., Huang, Z., Zhang, Y., Zhao, X. (2017). Constitutive modeling of polycarbonate over a wide range of strain rates and temperatures, Mechanics of Time-Dependent Materials, 21(1), pp. 97-117. DOI: https://doi.org/10.1007/s11043-016-9320-1.
[14] Taylor, D. (2008). The theory of critical distances, Engineering Fracture Mechanics, 75(7), pp. 1696-1705.
[15] Lazzarin, P., Zambardi, R. (2001). A finite-volume-energy based approach to predict the static and fatigue behavior of components with sharp V-shaped notches, International Journal of Fracture, 112(3), pp. 275-298.
DOI: https://doi.org/10.1023/A:1013595930617.
[16] Justo, J., Castro, J., Cicero, S. (2020). Notch effect and fracture load predictions of rock beams at different temperatures using the Theory of Critical Distances, International Journal of Rock Mechanics and Mining Sciences, 125, p. 104161.
[17] Ye, W.-L., Zhu, S.-P., Niu, X., He, J.-C., Correia, J.A. (2022). Fatigue life prediction of notched components under size effect using critical distance theory, Theoretical and Applied Fracture Mechanics, 121, p. 103519.
[18] Morgan, D., Quinlan, S., Taylor, D. (2022). Using the theory of critical distances to predict notch effects in fibre composites, Theoretical and Applied Fracture Mechanics, 118, p. 103285.
[19] Sutton, M.A., Orteu, J.J., Schreier, H. (2009). Image correlation for shape, motion and deformation measurements: basic concepts, theory and applications, Springer Science & Business Media.
[20] Hao, W., Tan, L., Yang, X., Shi, D., Wang, M., Miao, G., Fan, Y. (2023). A physics-informed machine learning approach for notch fatigue evaluation of alloys used in aerospace, International Journal of Fatigue, 170, p. 107536.
[21] Liu, X., Athanasiou, C.E., Padture, N.P., Sheldon, B.W., Gao, H. (2020). A machine learning approach to fracture mechanics problems, Acta Materialia, 190, pp. 105-112. DOI: 10.1016/j.actamat.2020.03.016.
[22] Aldakheel, F., Elsayed, E.S., Heider, Y., Weeger, O. (2025). Physics-based machine learning for computational fracture mechanics, Machine Learning for Computational Science and Engineering, 1(1), p. 18.
DOI: https://doi.org/10.1007/s44379-025-00019-x.
[23] Xu, H., Fan, W., Taylor, A.C., Zhang, D., Ruan, L., Shi, R. (2023). Crack-Net: prediction of crack propagation in composites, arXiv Preprint arXiv:2309.13626.
[24] Mocerino, D., Zarzoso, M., Sket, F., Molina, J., González, C. (2024). A Machine Learning Boosted Data Reduction Methodology for Translaminar Fracture of Structural Composites, Applied Composite Materials, 31(6), pp. 1833-1848. DOI: https://doi.org/10.1007/s10443-024-10236-x.
[25] ASTM Standard. (2022). D638-22: Standard test method for tensile properties of plastics, West Conshohocken (PA): ASTM International. DOI: https://doi.org/10.1520/D0638-22.
[26] Albinmousa, J., AlSadah, J., Hawwa, M.A., Al-Qahtani, H.M. (2023). Estimation of Mixed-Mode I/II Fracture of UNotched Polycarbonate Specimens Using the TCD and SED Methods, Physical Mesomechanics, 26(1), pp. 66-81. DOI: https://doi.org/10.1134/S1029959923010083.
[27] Chen, T., Guestrin, C. (2016). XGBoost: A Scalable Tree Boosting System., Proceedings of the 22nd ACM SIGKDD International Conference on Knowledge Discovery and Data Mining, New York, NY, USA, Association for Computing Machinery, pp. 785-794.
[28] Ullah, I., Liu, K., Yamamoto, T., Al Mamlook, R.E., Jamal, A. (2022). A comparative performance of machine learning algorithm to predict electric vehicles energy consumption: A path towards sustainability, Energy & Environment, 33(8), pp. 1583-1612.
[2] Jadhav, V.D., Patil, A.J., Kandasubramanian, B. (2022). Polycarbonate Nanocomposites for High Impact Applications., In: Mallakpour, S., Hussain, C.M. eds., Handbook of Consumer Nanoproducts, Singapore, Springer Nature Singapore, pp. 257-281.
[3] Strong, A.B. (2006). Plastics: materials and processing, USA, Pearson Prentice Hall.
[4] Hotaka, T., Kondo, F., Niimi, R., Togashi, F., Morita, Y. (2019). Industrialization of automotive glazing by polycarbonate and hard-coating, Polymer Journal, 51(12), pp. 1249-1263.
DOI: https://doi.org/10.1038/s41428-019-0240-1.
[5] Alaboodi, A.S., Sivasankaran, S. (2018). Experimental design and investigation on the mechanical behavior of novel 3D printed biocompatibility polycarbonate scaffolds for medical applications, Journal of Manufacturing Processes, 35, pp. 479-491. DOI: https://doi.org/10.1016/j.jmapro.2018.08.035.
[6] Zhang, W., Xu, Y. (2019). Mechanical properties of polycarbonate: experiment and modeling for aeronautical and aerospace applications, Elsevier.
[7] Ab Rahim, N.R., Dr Seyed Jamalaldin Seyed Hakim. (2022). Performance of Polycarbonate Concrete Panels in Construction: A Critical Research Review, Rtcebe, 3(1), pp. 320-331.
[8] Gupta, A., Goyal, R. (2019). Electrical properties of polycarbonate/expanded graphite nanocomposites, Journal of Applied Polymer Science, 136(13), p. 47274.
[9] Albinmousa, J., AlSadah, J., Hawwa, M.A., Al-Qahtani, H.M. (2021). Estimation of mode I fracture of u-notched polycarbonate specimens using the equivalent material concept and strain energy density, Applied Sciences, 11(8), p. 3370.
[10] Grellmann, W., Langer, B. (2017). Deformation and fracture behaviour of polymer materials, vol. 247, Springer.
[11] Gearing, B., Anand, L. (2004). Notch-sensitive fracture of polycarbonate, International Journal of Solids and Structures, 41(3-4), pp. 827-845.
[12] Faye, A., Parameswaran, V., Basu, S. (2016). Effect of notch-tip radius on dynamic brittle fracture of polycarbonate, Experimental Mechanics, 56, pp. 1051-1061.
[13] Wang, H., Zhou, H., Huang, Z., Zhang, Y., Zhao, X. (2017). Constitutive modeling of polycarbonate over a wide range of strain rates and temperatures, Mechanics of Time-Dependent Materials, 21(1), pp. 97-117. DOI: https://doi.org/10.1007/s11043-016-9320-1.
[14] Taylor, D. (2008). The theory of critical distances, Engineering Fracture Mechanics, 75(7), pp. 1696-1705.
[15] Lazzarin, P., Zambardi, R. (2001). A finite-volume-energy based approach to predict the static and fatigue behavior of components with sharp V-shaped notches, International Journal of Fracture, 112(3), pp. 275-298.
DOI: https://doi.org/10.1023/A:1013595930617.
[16] Justo, J., Castro, J., Cicero, S. (2020). Notch effect and fracture load predictions of rock beams at different temperatures using the Theory of Critical Distances, International Journal of Rock Mechanics and Mining Sciences, 125, p. 104161.
[17] Ye, W.-L., Zhu, S.-P., Niu, X., He, J.-C., Correia, J.A. (2022). Fatigue life prediction of notched components under size effect using critical distance theory, Theoretical and Applied Fracture Mechanics, 121, p. 103519.
[18] Morgan, D., Quinlan, S., Taylor, D. (2022). Using the theory of critical distances to predict notch effects in fibre composites, Theoretical and Applied Fracture Mechanics, 118, p. 103285.
[19] Sutton, M.A., Orteu, J.J., Schreier, H. (2009). Image correlation for shape, motion and deformation measurements: basic concepts, theory and applications, Springer Science & Business Media.
[20] Hao, W., Tan, L., Yang, X., Shi, D., Wang, M., Miao, G., Fan, Y. (2023). A physics-informed machine learning approach for notch fatigue evaluation of alloys used in aerospace, International Journal of Fatigue, 170, p. 107536.
[21] Liu, X., Athanasiou, C.E., Padture, N.P., Sheldon, B.W., Gao, H. (2020). A machine learning approach to fracture mechanics problems, Acta Materialia, 190, pp. 105-112. DOI: 10.1016/j.actamat.2020.03.016.
[22] Aldakheel, F., Elsayed, E.S., Heider, Y., Weeger, O. (2025). Physics-based machine learning for computational fracture mechanics, Machine Learning for Computational Science and Engineering, 1(1), p. 18.
DOI: https://doi.org/10.1007/s44379-025-00019-x.
[23] Xu, H., Fan, W., Taylor, A.C., Zhang, D., Ruan, L., Shi, R. (2023). Crack-Net: prediction of crack propagation in composites, arXiv Preprint arXiv:2309.13626.
[24] Mocerino, D., Zarzoso, M., Sket, F., Molina, J., González, C. (2024). A Machine Learning Boosted Data Reduction Methodology for Translaminar Fracture of Structural Composites, Applied Composite Materials, 31(6), pp. 1833-1848. DOI: https://doi.org/10.1007/s10443-024-10236-x.
[25] ASTM Standard. (2022). D638-22: Standard test method for tensile properties of plastics, West Conshohocken (PA): ASTM International. DOI: https://doi.org/10.1520/D0638-22.
[26] Albinmousa, J., AlSadah, J., Hawwa, M.A., Al-Qahtani, H.M. (2023). Estimation of Mixed-Mode I/II Fracture of UNotched Polycarbonate Specimens Using the TCD and SED Methods, Physical Mesomechanics, 26(1), pp. 66-81. DOI: https://doi.org/10.1134/S1029959923010083.
[27] Chen, T., Guestrin, C. (2016). XGBoost: A Scalable Tree Boosting System., Proceedings of the 22nd ACM SIGKDD International Conference on Knowledge Discovery and Data Mining, New York, NY, USA, Association for Computing Machinery, pp. 785-794.
[28] Ullah, I., Liu, K., Yamamoto, T., Al Mamlook, R.E., Jamal, A. (2022). A comparative performance of machine learning algorithm to predict electric vehicles energy consumption: A path towards sustainability, Energy & Environment, 33(8), pp. 1583-1612.
Nomenclature
| Notch radius | |
| Notch depth | |
| Inherent Strength of material |