An experimental study into the net cross-sectional failure of damaged plates with holes for different steel grades and temperatures
Introduction
The EN 1993-1-1 [1] provides design rules against various failure modes in steel structures, which are applicable to plain and notched components, and structural connections for steel grades up to S460 under ambient temperature conditions (
where
where A is the gross cross-sectional area,
recommends using the same value for
recommends using the same value for
The factor 0.9 has been the subject of study of multiple researchers, who aimed to investigate the applicability and conservatism of the design rule presented as in Eqn. 4. It should be noted that in other international standards such as AISC360 [7] in clause D2 do not include the factor 0.9 in the formulation of the resistance function. The factor 0.9 is based on test evaluations of bolted connections loaded in tension and the potential presence of cracks around the hole, potentially lowering the net cross-sectional resistance of the element. Rombouts et al. [8] investigated 28 specimens of steel grade S235 with different bolt configurations where the net cross-section failure is decisive over the gross crosssectional resistance. The conclusion of this research was that the additional safety value of 0.9 can be omitted, for both plates with and without bolts. Snijder et al. [9] investigated the net cross-sectional resistance of additional bolt-hole configurations for different steel grades, namely S235 and S460, by validating a finite element model with test results and subsequently using it to generate additional numerical results. They found that the current partial factor in Eqn. 3,
In Engineering Critical Assessment, the structural integrity of components containing crack-like defects is assessed using the Failure Assessment Diagram (FAD). This FAD considers two competing failure modes, namely brittle fracture and plastic collapse, through a material dependent interaction curve. This method has been used for a large variety of metals [12-14] and applications [15-16] spanning from civil structures, to mechanical components, and nuclear reactors.
This research aims at complementing and providing additional evidence concerning the applicability of the design rule for tension members in Eurocode 3, by investigating the ultimate resistance of specimens with different bolt-hole configurations in the presence of relatively short cracks induced by fatigue. Two steel grades are considered, namely S275JR and S700MC. In addition, the effect of low temperature on the tensile resistance of high-strength steel is investigated. Also, the FAD is used to predict the experimental results.
In Engineering Critical Assessment, the structural integrity of components containing crack-like defects is assessed using the Failure Assessment Diagram (FAD). This FAD considers two competing failure modes, namely brittle fracture and plastic collapse, through a material dependent interaction curve. This method has been used for a large variety of metals [12-14] and applications [15-16] spanning from civil structures, to mechanical components, and nuclear reactors.
This research aims at complementing and providing additional evidence concerning the applicability of the design rule for tension members in Eurocode 3, by investigating the ultimate resistance of specimens with different bolt-hole configurations in the presence of relatively short cracks induced by fatigue. Two steel grades are considered, namely S275JR and S700MC. In addition, the effect of low temperature on the tensile resistance of high-strength steel is investigated. Also, the FAD is used to predict the experimental results.
Methods
Experimental Program
This research investigates the net cross-sectional behavior of uncracked and pre-cracked steel specimens with bolt holes, made from S275JR and S700MC steel grades. In the first phase of the experiments, material characterization was conducted using tensile coupon tests for S700MC steel. Since the material properties for the S275JR steel plates used to fabricate the specimens were already available from Baarssen et al. [10], additional tensile coupon tests for this steel grade were not performed. The experimental program included four different bolt-hole configurations, as shown in Tab. 1, namely a center bolt hole (type A), an eccentric bolt hole (type B), double bolt holes (type C) and double staggered bolt holes (type D). Ultimately, all specimens were subjected to monotonic tensile loading to determine the net cross-sectional resistance. Three types of experiments are conducted as outlined below:
- Tensile tests on specimens;
- Tensile tests on pre-cracked specimens;
- Tensile tests on pre-cracked and cooled specimens;
The pre-cracked specimens were first subjected to cyclic tensile loading until fatigue cracks initiate at least one side of the hole. The tests on cooled specimens were performed after removal of the test specimen from the environmental chamber at room conditions. Further details are given in the next sections.
| Specimen | Description | |||||||
| Type A | Specimen with one hole located centrically in the middle of the plate | 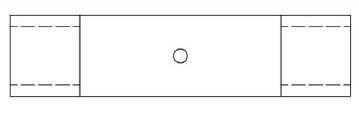 |
||||||
| Type B | Specimen with one hole located eccentrically in the middle of the plate | |||||||
| Type C | Specimen with two holes located in the middle of the plate | 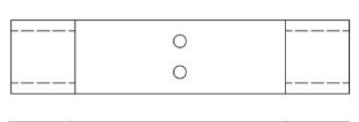 |
||||||
| Type D | Specimen with two staggered holes |
|
Table 1: Specification of studied bolt-hole configurations.
Monotonic Tensile Tests on material coupons
To determine the material properties of steel grade S700MC, a total of five coupon tests (S700MC-T1 to S700MC-T5) are carried out. The specimens are fabricated according to the specifications provided in the ASTM E 8M standard. They are first extracted by waterjet cutting from hot-rolled plates and successively machined. The longitudinal axis of the specimens is coincident with the rolling direction.
The tests are executed in a universal Instron testing machine with a maximum capacity of 250 kN and equipped with a load cell of the same nominal capacity. The tests are executed by controlling the displacement of the cross-head at a constant rate of
The uniaxial engineering stress-strain curves for the S700MC and S275JR steel are depicted in Fig. 1. The mean uniaxial material properties are summarized in Tab. 2, where the lower yield strength is used to define the yield strength. The Young modulus is determined by fitting a linear regression model to the linear elastic range of the stress stress-strain curve up to
The tests are executed in a universal Instron testing machine with a maximum capacity of 250 kN and equipped with a load cell of the same nominal capacity. The tests are executed by controlling the displacement of the cross-head at a constant rate of
The uniaxial engineering stress-strain curves for the S700MC and S275JR steel are depicted in Fig. 1. The mean uniaxial material properties are summarized in Tab. 2, where the lower yield strength is used to define the yield strength. The Young modulus is determined by fitting a linear regression model to the linear elastic range of the stress stress-strain curve up to

Figure 1: Engineering stress-strain of coupon specimens for S700MC and S275JR steel grade at room temperature. Data for S275JR are from Baarssen et al. [10].
| Material | Young Modulus (GPa) | Yield Strength (MPa) | Ultimate Tensile Strength (MPa) | Strain in UTS (%) |
| S275JR* | 200 | 307 | 431 | 20 |
| S700MC | 204 | 772 | 813 | 10 |
| *Data from [9] | ||||
Table 2: Properties of S275JR and S700MC steel.
Tests on specimens with bolt holes
The geometry and dimensions of the specimens used for the experiments are depicted in Fig. 2 and Tab. 3. Waterjet cutting is used to extract specimens from hot-rolled plates. As for the tensile coupons, the longitudinal direction of the specimens coincides with the rolling direction. Afterwards, the bolt holes were drilled. Due to the fact that the specimens have a uniform width over their length, the sides of the specimens were grinded in order to smoothen the edges and avoid the initiation of fatigue cracks from the rough surface resulting from waterjet cutting.
As mentioned in the previous section, three types of tests are executed:
As mentioned in the previous section, three types of tests are executed:
- In the first type, specimens without cracks are subjected to monotonic tensile loading. These specimens are identified by their steel grade and configuration type (A, B, C, or D).
- In the second type, specimens are first subjected to cyclic loading with a load ratio of
- In the third type, specimens are tested as in (2.) the pre-cracked specimens are first cooled in a freezer at
Both monotonic tensile tests and pre-cracking are conducted using an hydraulic Schenck testing machine with a capacity of 400 kN . For tensile tests on cooled specimens, the universal testing machine from Instron adopted for the coupon tests is used. This is because the Schenck test bench is equipped with mechanical manual wedge grips, whereas the Instron test bench is equipped with wedge grips actuated with a screw, which allow a significantly faster gripping procedure, hence minimizing the temperature increase in the specimens. In any case, the tensile tests are performed under displacement control, starting at a rate of

Figure 2: Specimen geometry.
| Geometric properties [mm] | S275JRType A | S275JRType B | S275JRType C | S275JRType D | S700MCType A | S700MCType B | S700MCType C | S700MCType D | |
| Width | 110 | 110 | 110 | 110 | 70 | 70 | 70 | 70 | |
| Length | L | 280 | 400 | 320 | 340 | 175 | 250 | 200 | 212 |
| Thickness | t | 8 | 8 | 8 | 8 | 5 | 5 | 5 | 5 |
| Number of holes | n | 1 | 1 | 2 | 2 | 1 | 1 | 2 | 2 |
| Hole diameter | d0 | 18 | 18 | 18 | 18 | 12 | 12 | 12 | 12 |
| Edge distance 1 | e1 | - | 30 | - | - | - | 20 | - | - |
| Edge distance 2 | e2 | - | 80 | - | - | - | 50 | - | - |
| Horizontal distance | p1 | - | - | 50 | 50 | - | - | 30 | 30 |
| Vertical distance | - | - | - | 50 | - | - | - | 30 | |
Table 3: Nominal dimensions of S275JR and S700MC steel specimens.
For the pre-cracking procedure, the specimens are subjected to a force controlled cyclic loading characterized by a sinusoidal waveform with a load ratio of

Figure 3: Setup for pre-cracking procedure including setup of the broken wire electronic binary sensors.
During the monotonic tensile tests, three quantities are recorded:
- The applied force measured by the loadcell,
- The displacement of the actuator, or equivalently the crosshead displacement for the tests conducted in the Instron universal testing machine,
- The specimen average elongation measured by an LVDT with initial gauge length equal to the plate width, installed across the holes and spanning the center of the plate.
- For cooled specimens, the temperature is recorded in the vicinity of the pre-crack.
The failure assessment diagram
The Failure Assessment Diagram (FAD) is an approach used to evaluate the failure behavior of metal structures that contain crack-like flaws. It visualizes the type of failure graphically, where the placement of an assessment point with respect to the failure line indicates the type of failure that may occur in the assessed structural element.
The FAD considers two competing failure modes, namely brittle fracture and plastic collapse. Brittle fracture is assessed using linear elastic fracture mechanics theory by means of the Stress Intensity Factor (SIF)
The interaction between the failure modes is considered through a failure line, which is material dependent. In the British Standard BS7910 [17] the failure line can be constructed according to three options. In this work, Option 2 is considered. To obtain it, the full stress-strain curve of the material is used. This ensures a more realistic and less conservative assessment as compared to Option 1, which is crucial for safety standards. In order to obtain the SIF and the reference stress, existing solutions in BS7910 [17] have been used for corner cracks at holes, in which the crack sizes are obtained from the fracture surface. The approach is only employed here for the specimens in steel grade S700MC and type A. This is because of two reasons: (1) FAD has been shown to be successful for S275JR in previous research work [9, 18], and (2) stress intensity factor and reference stress solutions for other hole configurations do not exist, and their derivation is outside of the scope of this work. The procedure to estimate the material fracture toughness is the same as adopted in
[18]. The material fracture toughness in terms of stress intensity factor including constraint correction,
The FAD considers two competing failure modes, namely brittle fracture and plastic collapse. Brittle fracture is assessed using linear elastic fracture mechanics theory by means of the Stress Intensity Factor (SIF)
The interaction between the failure modes is considered through a failure line, which is material dependent. In the British Standard BS7910 [17] the failure line can be constructed according to three options. In this work, Option 2 is considered. To obtain it, the full stress-strain curve of the material is used. This ensures a more realistic and less conservative assessment as compared to Option 1, which is crucial for safety standards. In order to obtain the SIF and the reference stress, existing solutions in BS7910 [17] have been used for corner cracks at holes, in which the crack sizes are obtained from the fracture surface. The approach is only employed here for the specimens in steel grade S700MC and type A. This is because of two reasons: (1) FAD has been shown to be successful for S275JR in previous research work [9, 18], and (2) stress intensity factor and reference stress solutions for other hole configurations do not exist, and their derivation is outside of the scope of this work. The procedure to estimate the material fracture toughness is the same as adopted in
[18]. The material fracture toughness in terms of stress intensity factor including constraint correction,
where
where
Results
Atotal of 51 tests are conducted, the results are reported in Tab. 4 for each specimen type and material. In this table,
Generally, three types of cracks have been induced, namely corner cracks, semi elliptical surface breaking cracks, and through the thickness cracks. Through the thickness cracks often result from two corner cracks coalesced together. Semi elliptical surface breaking cracks have been found in conjunction with corner cracks and considered as through the thickness cracks for the purpose of conducting the assessment according to the FAD, in accordance with the crack interaction rules in [16].
The cracks generated are generally smaller than 2 mm , with the majority being in the range
The type of test is recognizable from the specimen ID, as indicated in the previous section. Fig. 4a shows a typical loadelongation plot resulting from the tests for both steel grades and for both non pre-cracked and pre-cracked specimens. From this, it can be seen that the presence of cracks marginally affects the failure load and the deformation capacity of the specimen, however the number of test data for each specific testing condition is not deemed sufficient to draw statistically relevant conclusions. Fig. 4b shows the unity check resulting from the ratio between the failure load obtained experimentally and the ultimate load predicted by the design rule, i.e.
example of fracture surface, namely specimen S700MC-A1-C-T. It can be observed that despite the presence of the crack, the failure mechanism of the cross-section is mainly ductile. In the vicinity of the crack, lateral contraction is inhibited due to local stress triaxiality induced by the notch and the crack. This can be observed by looking at the lateral contraction at the two sides of the hole, where the thickness at the side without the crack is significantly reduced. However, lateral contraction is largely present in the failure region demonstrating a ductile failure mode. Fig. 5b shows the type and the size of the crack induced by the pre-cracking procedure.
Generally, three types of cracks have been induced, namely corner cracks, semi elliptical surface breaking cracks, and through the thickness cracks. Through the thickness cracks often result from two corner cracks coalesced together. Semi elliptical surface breaking cracks have been found in conjunction with corner cracks and considered as through the thickness cracks for the purpose of conducting the assessment according to the FAD, in accordance with the crack interaction rules in [16].
The cracks generated are generally smaller than 2 mm , with the majority being in the range
The type of test is recognizable from the specimen ID, as indicated in the previous section. Fig. 4a shows a typical loadelongation plot resulting from the tests for both steel grades and for both non pre-cracked and pre-cracked specimens. From this, it can be seen that the presence of cracks marginally affects the failure load and the deformation capacity of the specimen, however the number of test data for each specific testing condition is not deemed sufficient to draw statistically relevant conclusions. Fig. 4b shows the unity check resulting from the ratio between the failure load obtained experimentally and the ultimate load predicted by the design rule, i.e.
example of fracture surface, namely specimen S700MC-A1-C-T. It can be observed that despite the presence of the crack, the failure mechanism of the cross-section is mainly ductile. In the vicinity of the crack, lateral contraction is inhibited due to local stress triaxiality induced by the notch and the crack. This can be observed by looking at the lateral contraction at the two sides of the hole, where the thickness at the side without the crack is significantly reduced. However, lateral contraction is largely present in the failure region demonstrating a ductile failure mode. Fig. 5b shows the type and the size of the crack induced by the pre-cracking procedure.
| Type A | Type B | Type C | Type D | ||||
| S700MC | |||||||
| S700MC-A1-C-T* | 238 | S700MC-B1-C-T* | 231 | S700MC-C1 | 195 | S700MC-D1-C-T* | 188 |
| S700MC-A2-C-T* | 236 | S700MC-B2-C | 237 | S700MC-C2 | 198 | S700MC-D2-C-T |
176 |
| S700MC-A3-C | 235 | S700MC-B3-C-T* | 235 | S700MC-C3 | 199 | S700MC-D3-C | 220 |
| S700MC-A4-C | 237 | S700MC-B4 | 244 | S700MC-C4 | 192 | S700MC-D4-C | 220 |
| S700MC-A5-C | 241 | S700MC-B5 | 242 | S700MC-C5-C | 191 | S700MC-D5 | 218 |
| S700MC-A6 | 244 | S700MC-B6 | 242 | S700MC-C6-C | 201 | S700MC-D6 | 222 |
| S700MC-C7-C | 200 | S700MC-D7 | 222 | ||||
| S700MC-C8-C | 198 | ||||||
| 172 | 175 | 169 | Nu [kN] | 170 | |||
| S275JR | |||||||
| S275JR-A1 | 327 | S275JR-B1 | 312 | S275JR-C1 | 275 | S275JR-D1 | 293 |
| S275JR-A2 | 325 | S275JR-B2 | 313 | S275JR-C2 | 276 | S275JR-D2 | 291 |
| S275JR-A3 | 326 | S275JR-B3 | 313 | S275JR-C3 | 273 | S275JR-D3 | 293 |
| S275JR-A4-C | 322 | S275JR-B4-C | 309 | S275JR-C4-C | 272 | S275JR-D4-C | 277 |
| S275JR-A5-C | 319 | S275JR-B5-C | 307 | S275JR-C5-C | 274 | S275JR-D5-C | 293 |
| S275JR-C6-C | 273 | S275JR-D6-C | 290 | ||||
| S275JR-C7-C | 274 | S275JR-D7-C | 230 | ||||
| 285 | 285 | 231 | 269 | ||||
| *S700MC-A1-C-T fractured at |
|||||||
| S700MC-B1-C-T fractured at |
|||||||
| S700MC-D1-C-T fractured at |
|||||||
Table 4: Summary of experimental results grouped by specimen geometry.

Figure 4: Overview of experimental results grouped by steel grade and specimen geometry.

Figure 5: Assessment using the Failure Assessment Diagram.
Failure Assessment Diagram
Only the specimens made of steel grade S700 have been assessed also using the FAD. The results are depicted in Fig. 6. In particular, the failure assessment point is reported for each pre-cracked specimen of type A. All the assessment points fall in the plastic collapse region, hence brittle failure is not deemed to occur despite the high steel grade, which is in line with the experiments. All the assessment points fall in the unacceptable region outside of the line, implying that the ultimate load that is predicted by the Failure Assessment Diagram is generally conservative. The predicted failure load by the FAD is 0.86 times smaller than the experimental failure load. This ratio is characterized by a coefficient of variation of 0.02 . Considering the typical scatter in the FAD [14], this is significantly small. It appears that the FAD can be used to predict the failure load of notched specimens containing relatively small cracks, also for relatively high steel grades with reasonable accuracy, provided that solutions for Stress Intensity Factor and reference stress are provided.
The use of the FAD is bounded by the availability of reference stress and stress intensity factor solutions for the considered crack configuration and load applied. Numerical methods, such as finite element analyses can be used to obtain these solutions and extend the use of the FAD to other relevant geometries.
The use of the FAD is bounded by the availability of reference stress and stress intensity factor solutions for the considered crack configuration and load applied. Numerical methods, such as finite element analyses can be used to obtain these solutions and extend the use of the FAD to other relevant geometries.

Figure 6: Assessment using the Failure Assessment Diagram.
Conclusions
In this work, several experiments were conducted to assess the applicability of the net cross-section design rule of EN1993-1-1 for the design of notched elements in tension. Particularly, in this study a relatively high steel grade was used, as compared to previous work. This study is conducted on specimens with and without relatively small fatigue cracks, i.e. generally shorter than 1 mm . These cracks have been induced by a pre-cracking procedure involving cyclic loading. The termination of the pre-cracking procedure is controlled by the broken wire method, which is able to detect such small cracks.
The experiments indicate that the failure load is not practically affected by the presence of relatively small cracks. This result is valid for both considered steel grades, namely S275JR and S700MC. Moreover, the failure load appears to be also marginally affected by low temperatures. The Failure Assessment Diagram has been adopted to predict the failure load of pre-cracked specimens for S700MC steel grade. The prediction is in line with the experimental data, and suggests that the failure is mainly ductile, as confirmed by an examination of fracture surfaces and the load-displacement behavior recorded during the tests.
Considering the experiments carried out in this and previous work, it appears that for the considered geometry and loading conditions, the considered design rule leads to predictions which are on the safe side. Hence, future tests should be conducted in loading and temperature conditions promoting a brittle behavior, in order to verify the prediction of the design rule in these circumstances. Given its reliable predictions, the FAD can be of help in identifying such conditions.
The experiments indicate that the failure load is not practically affected by the presence of relatively small cracks. This result is valid for both considered steel grades, namely S275JR and S700MC. Moreover, the failure load appears to be also marginally affected by low temperatures. The Failure Assessment Diagram has been adopted to predict the failure load of pre-cracked specimens for S700MC steel grade. The prediction is in line with the experimental data, and suggests that the failure is mainly ductile, as confirmed by an examination of fracture surfaces and the load-displacement behavior recorded during the tests.
Considering the experiments carried out in this and previous work, it appears that for the considered geometry and loading conditions, the considered design rule leads to predictions which are on the safe side. Hence, future tests should be conducted in loading and temperature conditions promoting a brittle behavior, in order to verify the prediction of the design rule in these circumstances. Given its reliable predictions, the FAD can be of help in identifying such conditions.
References
[1] EN 1993-1-1 (2005) Eurocode 3: Design of steel structures - Part 1-1: General rules and rules for buildings, CEN, Brussels.
[2] Može, P., Beg, D., Lopatič, J. (2007). Net cross-section design resistance and local ductility of elements made of high strength steel, J. Constr. Steel Res., 63(11), pp. 1431-1441. DOI: 10.1016/j.jcsr.2007.01.009.
[3] EN 1993-1-12 (February 2007) Eurocode 3: Design of steel structures - Part 1-12: Additional rules for the extension of EN 1993 up to steel grades S 700, CEN, Brussels.
[4] Tong, L., Niu, L., Jing, S., Ai, L., Zhao, X. L. (2018). Low temperature impact toughness of high strength structural steel," Thin-Walled Struct., 132, pp. 410-420. DOI: 10.1016/j.tws.2018.09.009.
[5] Yan, J. B., Luo, Y. L., Lin, X., Luo, Y. B., Zhang, L. (2021). Effects of the Arctic low temperature on mechanical properties of Q690 and Q960 high-strength steels, Constr. Build. Mater., 300, 124022. DOI: 10.1016/j.conbuildmat.2021.124022.
[6] Sedlacek, G., Feldmann, M., Kühn, B., Tschickardt, D., Höhler, S., Müller, C., Hensen, W., Stranghöner, N., Dahl, W., Langenberg, P., Münstermann, S., Brozetti, J., Raoul, J., Pope, R., Bijlaard, F., (2008). Commentary and Worked examples to EN 1993-1-10 "Material toughness and through thickness properties" and other toughness oriented rules in EN 1993, p. 262.
[7] AISC Committee. (2010). Specification for structural steel buildings (ANSI/AISC 360-10). American Institute of Steel Construction, Chicago-Illinois.
[8] Rombouts, I.M.J., Francken, W.L., Dekker, R.W.A., Snijder, H.H., (2014). Investigation of the net cross-section failure mechanism, Eurosteel 2014.
[9] Snijder, H. H., Dekker, R. W. A. and Teeuwen, P. A. (2017). Net cross-section failure of steel plates at bolt holes: Numerical work and statistical assessment of design rules, Ce/Papers, 1(2-3), pp. 3679-3688.
DOI: 10.1002/cepa.424.
[10] Baarssen, H., Van Maanen, J. W., Leonetti, D. and Snijder, H. H. (2022). An experimental investigation on the net cross-section failure of damaged plates containing holes, Procedia Struct. Integr., 41, pp. 183-191. DOI: 10.1016/j.prostr.2022.05.020.
[11] Raeisi, F., Mufti, A., Mustapha, G. and Thomson, D. J. (2017). Crack detection in steel girders of bridges using a broken wire electronic binary sensor. Journal of Civil Structural Health Monitoring, 7(2), pp. 233-243. DOI: 10.1007/s13349-017-0211-1
[12] Ainsworth, R. A. (1996). Failure assessment diagrams for use in R6 assessments for austenitic components. International journal of pressure vessels and piping, 65(3), pp. 303-309. DOI: 10.1016/0308-0161(94)00141-5.
[13] Han, J. J., Larrosa, N., Kima, Y. J. and Ainsworth, R. A. (2016). Blunt defect assessment in the framework of the failure assessment diagram. International Journal of Pressure Vessels and Piping, 146, pp. 39-54. DOI: 10.1016/j.ijpvp.2016.07.006
[14] Maljaars, J., Rózsás, Á., Walters, C. L. and Slot, H. (2022). Uncertainty quantification of the failure assessment diagram for flawed steel components in BS 7910: 2019. Engineering Fracture Mechanics, 268, 108446. DOI: 10.1016/j.engfracmech.2022.108446
[15] Bergant, M. A., Yawny, A. A. and Ipiña, J. E. P. (2015). Failure assessment diagram in structural integrity analysis of steam generator tubes. Procedia Materials Science, 8, pp. 128-138. DOI: 10.1016/j.mspro.2015.04.056
[16] Leander, J. and Al-Emrani, M. (2016). Reliability-based fatigue assessment of steel bridges using LEFM-A sensitivity analysis. International Journal of Fatigue, 93, pp. 82-91. DOI: 10.1016/j.ijfatigue.2016.08.011
[17] BSI (2019). BS EN 7910:2019. Guide to methods for assessing the acceptability of flaws in metallic structures.
[18] van Schuppen, B. B., Philips, R. R., Leonetti, D. D. and Snijder, H. B. (2024). An experimental evaluation of the net cross-sectional failure mechanism in Eurocode 3 for different hole configurations in presence of cracks. Procedia Structural Integrity, 66, pp. 412-418. DOI: 10.1016/j.prostr.2024.11.093
[19] Cochrane, V. H. (1922). Rules for rivet hole deductions in tension members. Engineering News-Record, 89(20), pp. 847-848.
[2] Može, P., Beg, D., Lopatič, J. (2007). Net cross-section design resistance and local ductility of elements made of high strength steel, J. Constr. Steel Res., 63(11), pp. 1431-1441. DOI: 10.1016/j.jcsr.2007.01.009.
[3] EN 1993-1-12 (February 2007) Eurocode 3: Design of steel structures - Part 1-12: Additional rules for the extension of EN 1993 up to steel grades S 700, CEN, Brussels.
[4] Tong, L., Niu, L., Jing, S., Ai, L., Zhao, X. L. (2018). Low temperature impact toughness of high strength structural steel," Thin-Walled Struct., 132, pp. 410-420. DOI: 10.1016/j.tws.2018.09.009.
[5] Yan, J. B., Luo, Y. L., Lin, X., Luo, Y. B., Zhang, L. (2021). Effects of the Arctic low temperature on mechanical properties of Q690 and Q960 high-strength steels, Constr. Build. Mater., 300, 124022. DOI: 10.1016/j.conbuildmat.2021.124022.
[6] Sedlacek, G., Feldmann, M., Kühn, B., Tschickardt, D., Höhler, S., Müller, C., Hensen, W., Stranghöner, N., Dahl, W., Langenberg, P., Münstermann, S., Brozetti, J., Raoul, J., Pope, R., Bijlaard, F., (2008). Commentary and Worked examples to EN 1993-1-10 "Material toughness and through thickness properties" and other toughness oriented rules in EN 1993, p. 262.
[7] AISC Committee. (2010). Specification for structural steel buildings (ANSI/AISC 360-10). American Institute of Steel Construction, Chicago-Illinois.
[8] Rombouts, I.M.J., Francken, W.L., Dekker, R.W.A., Snijder, H.H., (2014). Investigation of the net cross-section failure mechanism, Eurosteel 2014.
[9] Snijder, H. H., Dekker, R. W. A. and Teeuwen, P. A. (2017). Net cross-section failure of steel plates at bolt holes: Numerical work and statistical assessment of design rules, Ce/Papers, 1(2-3), pp. 3679-3688.
DOI: 10.1002/cepa.424.
[10] Baarssen, H., Van Maanen, J. W., Leonetti, D. and Snijder, H. H. (2022). An experimental investigation on the net cross-section failure of damaged plates containing holes, Procedia Struct. Integr., 41, pp. 183-191. DOI: 10.1016/j.prostr.2022.05.020.
[11] Raeisi, F., Mufti, A., Mustapha, G. and Thomson, D. J. (2017). Crack detection in steel girders of bridges using a broken wire electronic binary sensor. Journal of Civil Structural Health Monitoring, 7(2), pp. 233-243. DOI: 10.1007/s13349-017-0211-1
[12] Ainsworth, R. A. (1996). Failure assessment diagrams for use in R6 assessments for austenitic components. International journal of pressure vessels and piping, 65(3), pp. 303-309. DOI: 10.1016/0308-0161(94)00141-5.
[13] Han, J. J., Larrosa, N., Kima, Y. J. and Ainsworth, R. A. (2016). Blunt defect assessment in the framework of the failure assessment diagram. International Journal of Pressure Vessels and Piping, 146, pp. 39-54. DOI: 10.1016/j.ijpvp.2016.07.006
[14] Maljaars, J., Rózsás, Á., Walters, C. L. and Slot, H. (2022). Uncertainty quantification of the failure assessment diagram for flawed steel components in BS 7910: 2019. Engineering Fracture Mechanics, 268, 108446. DOI: 10.1016/j.engfracmech.2022.108446
[15] Bergant, M. A., Yawny, A. A. and Ipiña, J. E. P. (2015). Failure assessment diagram in structural integrity analysis of steam generator tubes. Procedia Materials Science, 8, pp. 128-138. DOI: 10.1016/j.mspro.2015.04.056
[16] Leander, J. and Al-Emrani, M. (2016). Reliability-based fatigue assessment of steel bridges using LEFM-A sensitivity analysis. International Journal of Fatigue, 93, pp. 82-91. DOI: 10.1016/j.ijfatigue.2016.08.011
[17] BSI (2019). BS EN 7910:2019. Guide to methods for assessing the acceptability of flaws in metallic structures.
[18] van Schuppen, B. B., Philips, R. R., Leonetti, D. D. and Snijder, H. B. (2024). An experimental evaluation of the net cross-sectional failure mechanism in Eurocode 3 for different hole configurations in presence of cracks. Procedia Structural Integrity, 66, pp. 412-418. DOI: 10.1016/j.prostr.2024.11.093
[19] Cochrane, V. H. (1922). Rules for rivet hole deductions in tension members. Engineering News-Record, 89(20), pp. 847-848.